
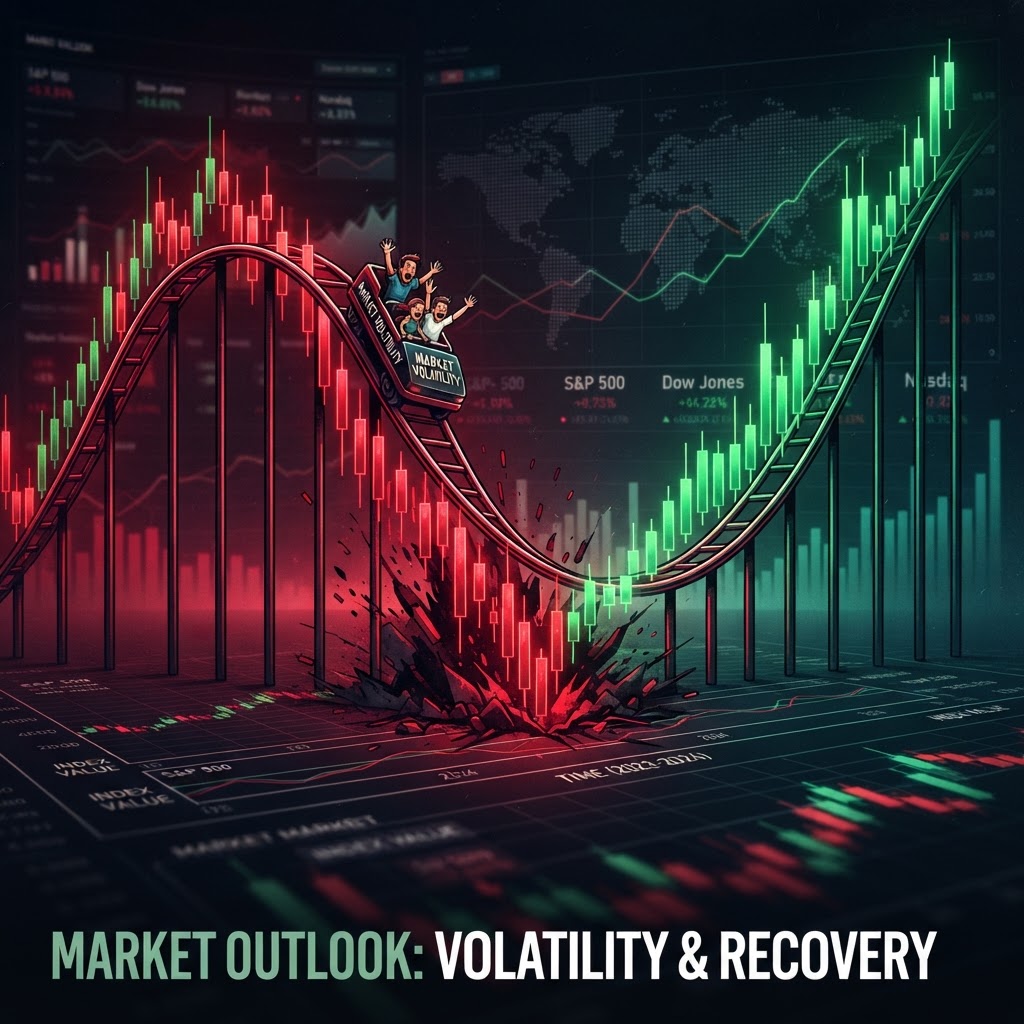
Volatility is the most misunderstood concept in investing. Most investors treat volatility as a synonym for risk, and they fear it for the same reasons they fear risk. But volatility and risk are not the same thing, and confusing them leads to some of the most expensive mistakes in investing. Volatility is a measure of how much prices move. Risk is a measure of the probability and magnitude of permanent loss. An asset can be highly volatile and low risk over long horizons, as the stock market has historically been. An asset can be low volatility and high risk, as certain supposedly safe bonds and structured products have proven. The VIX, which is the market’s most-watched volatility measure, is the key tool for reading volatility, and understanding what it actually signals is essential for any investor who wants to navigate market movements without being driven by fear.
What the VIX Actually Measures
The VIX, officially the CBOE Volatility Index, measures the stock market’s expectation of volatility over the next 30 days, derived from the prices of S&P 500 index options. It is not a measure of past volatility. It is a forward-looking measure, based on what options traders are pricing in. When the VIX is low, options markets are pricing in low expected volatility. When the VIX is high, options markets are pricing in high expected volatility. The VIX is often called the fear gauge, because it tends to spike during periods of market stress, but it is more precisely a measure of expected near-term price movement.
The VIX has a long-term average around 20, but it spends extended periods well below that level during calm markets and spikes well above it during crises. During the 2008 financial crisis, the VIX spiked above 80. During the 2020 pandemic crash, it spiked above 80 again. During extended bull markets, it can spend months below 15. These levels are not random. They reflect the genuine uncertainty that options traders see in the market, and they have real implications for how investors should position their portfolios.
Why the VIX Mean Reverts
One of the most reliable properties of the VIX is that it mean reverts. It does not stay at extreme levels indefinitely, because the conditions that cause spikes tend to resolve, and the conditions that cause complacency tend to be disrupted. A VIX above 30 has historically been a signal that fear is elevated and that forward returns for the stock market are above average, because extreme fear has historically been followed by recovery. A VIX below 12 has historically been a signal that complacency is high and that forward returns are below average, because periods of extreme complacency have often preceded disruptions.
This mean reversion is not a trading signal in the sense that it allows you to time the market precisely. It is a context signal that tells you what kind of environment you are in. When the VIX is high, the market is pricing in fear, and history suggests that patient investors are usually rewarded. When the VIX is low, the market is pricing in calm, and history suggests that investors should be more cautious. The VIX does not tell you what to do, but it tells you what the market is expecting, which is valuable context for any investment decision.
Volatility Spikes and What They Signal
When the VIX spikes sharply, it signals that options markets have rapidly repriced their expectation of near-term volatility. This typically happens during acute market stress — a sudden sell-off, a geopolitical shock, a financial system disruption. The spike itself is often more informative than the event that triggered it, because it tells you how much uncertainty the market is pricing in. A 20% VIX spike on a modest news event suggests the market was fragile and complacent. A modest VIX move on a major news event suggests the market is well-hedged and resilient.
One useful pattern to watch is the relationship between VIX spikes and subsequent market behavior. Historically, the sharpest VIX spikes have often marked short-term market bottoms, because the spike reflects capitulation — investors rushing to buy protection after a decline. When the VIX spikes and then begins to fall, it often signals that the acute phase of stress is passing. When the VIX remains elevated for an extended period, it signals that the stress is persistent and that the market is still uncertain about the resolution. Reading these patterns helps investors distinguish between transient shocks and persistent problems.
Volatility Clustering
Volatility does not arrive uniformly. It clusters. Periods of low volatility tend to be followed by more low volatility, and periods of high volatility tend to be followed by more high volatility. This clustering is one of the most robust empirical findings in financial markets, and it has important implications for investors. When the VIX has been low for an extended period, the probability of a volatility spike rises, because the conditions that produce low volatility — stability, low uncertainty, strong trends — tend to eventually be disrupted. When the VIX has been elevated for an extended period, the probability of a decline in volatility rises, because the conditions that produce high volatility tend to resolve.
This clustering means that volatility is, to some extent, predictable. Not in the sense that you can time exact spikes, but in the sense that you can identify regimes. A long period of sub-15 VIX readings is a regime of complacency that is likely to eventually be disrupted. A long period of above-30 VIX readings is a regime of stress that is likely to eventually resolve. Recognizing the regime helps investors position appropriately — more defensively during complacency regimes, more opportunistically during stress regimes.
Implied vs. Realized Volatility
A more sophisticated read on the VIX compares implied volatility, which is what the VIX measures, to realized volatility, which is how much the market actually moved over the same period. When implied volatility is higher than realized volatility, options are expensive, because the market is pricing in more movement than is actually occurring. When implied volatility is lower than realized volatility, options are cheap, because the market is pricing in less movement than is actually occurring. This spread is one of the most useful tools for sophisticated investors who want to understand whether the market is overpricing or underpricing risk.
For most investors, the practical takeaway is simpler. The VIX tells you what the options market expects, and comparing that to what actually happens tells you whether the market was right. Over time, the market tends to overprice fear during spikes and underprice it during calm periods, which is why strategies that sell volatility during spikes and buy it during calm have historically been profitable — though they carry tail risk that makes them unsuitable for most individual investors.
How to Use the VIX in Practice
For most investors, the VIX is best used as a context indicator rather than a trading signal. When the VIX is elevated, it tells you that fear is high and that patient investors have historically been rewarded. When the VIX is depressed, it tells you that complacency is high and that investors should be more thoughtful about risk. The VIX should not drive buy or sell decisions on its own, but it should inform the emotional posture you bring to those decisions. When the VIX is high and you are tempted to sell, the VIX is telling you that history suggests patience. When the VIX is low and you are tempted to take excessive risk, the VIX is telling you that the market may be underpricing the possibility of disruption.
The most important lesson about volatility is that it is the price of admission for long-term returns. The stock market has historically delivered real returns of around 7% per year over long periods, and those returns are only available to investors who are willing to accept the volatility that comes with them. Investors who try to eliminate volatility typically also eliminate returns, because they sell during the exact periods when returns are being generated. Read the VIX to understand what the market is expecting. Use it to check your emotional reactions against historical evidence. Do not let it drive you to trade volatility you cannot afford to hold through. The investors who stay invested through volatility, rather than trying to avoid it, are the ones who capture the compounding that volatility is the price of.